Influent vs Effluent: Key Differences in Water Treatment
Influent vs Effluent: Understanding the Key Differences in Water Treatment Processes
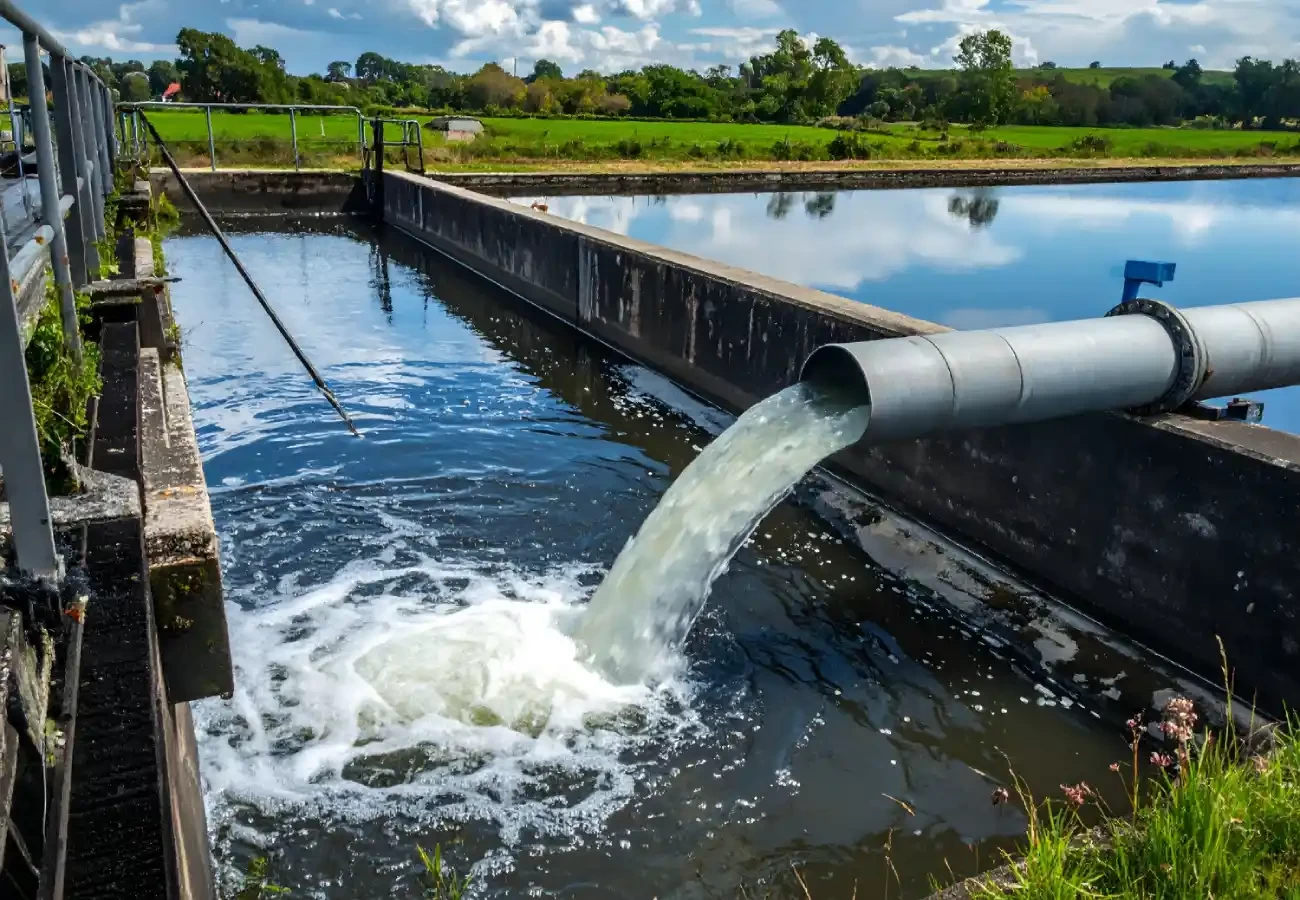
Influent refers to the untreated water entering a treatment plant, while effluent is the water discharged after treatment. Influent vs effluent shows which contaminants the plant has removed and whether the treated water meets its intended quality requirements.
Key Takeaways
- Influent is the untreated water entering a plant, and effluent is the treated water leaving it
- The difference between influent and effluent quality helps assess how well a treatment process performs
- Typical parameters compared are turbidity, suspended solids, TDS, hardness, pH and microbial quality, plus BOD and COD for wastewater
- Influent quality sets the design basis, and effluent quality must meet the drinking water, process water or discharge standard
- Sampling at both points, across seasons, is what keeps a plant on target
This blog explains what influent and effluent are, how they differ, which parameters change between them and why the comparison matters for design, compliance and day-to-day operation.
What is Influent in Water Treatment?
Influent is the raw water that reaches a treatment plant before any treatment step. For drinking water and industrial process applications, it may come from sources such as borewells, rivers, lakes, reservoirs or seawater. In a sewage treatment plant or effluent treatment plant, it is the incoming sewage or industrial wastewater.
What the influent carries depends on its source: suspended solids, hardness, dissolved salts, iron, manganese, colour, odour, organic load and microbes. Its quality also shifts with the season and with upstream activity, so influent is the starting point for every design decision.
What is Effluent in Water Treatment?
Effluent is the treated water that leaves a plant, or leaves a single stage inside it. Final effluent goes to users for drinking, to a process, to reuse or to discharge, and it must meet the standard that applies to that use. For drinking water, that is BIS IS 10500 or the WHO guidelines. For process water, it is the plant's own specification. For wastewater, it is the discharge limit set by the state pollution control board or the reuse standard.
Influent vs Effluent: Key Differences
| Aspect | Influent | Effluent |
|---|---|---|
| Meaning | Untreated water entering the plant | Treated water leaving the plant or a stage |
| Position | Inlet, before any treatment step | Outlet, after treatment |
| Quality | May be cloudy, hard, salty, coloured, organic-rich or contaminated | Treated to meet the required quality standards |
| Contaminant load | High turbidity, solids, hardness, TDS, organics and microbes | Reduced to the target level |
| Microbial quality | Pathogens may be present | Disinfected, with a residual where required |
| Why it is tested | To design the plant, size equipment and set chemical doses | To confirm the plant meets the standard |
| Standard applied | Used as the design basis, not as a compliance limit | Compared with the drinking water, process or discharge standard |
| Where it goes | Into the treatment train | To users, a process, reuse or discharge |
How Treatment Turns Influent into Effluent
Treatment is a series of steps, and each step takes in influent and sends out a cleaner effluent. Tracking that change stage by stage shows where each contaminant is removed and which step is underperforming.
| Stage | What enters (stage influent) | What leaves (stage effluent) | Main change |
|---|---|---|---|
| Screening and pre-treatment | Raw water with debris, grit and larger solids | Water free of coarse material | Protects pumps and later steps |
| Clarification | Water with fine suspended particles and colour | Clearer water | Turbidity and suspended solids fall sharply |
| Filtration | Clarified water with remaining fine particles | Polished water | Residual particles, organics and odour removed |
| Softening, ion exchange or membranes | Filtered water with hardness, salts or dissolved ions | Soft or low-TDS water | Dissolved impurities reduced |
| Disinfection | Water that is clear but may carry microbes | Water with reduced microbial contamination | Pathogens inactivated, with a disinfectant residual maintained where required |
Influent vs Effluent in Different Types of Plants
Drinking Water Plants
Influent is the raw source water, and effluent is the finished water sent into distribution. The comparison focuses on turbidity, hardness, TDS, metals, colour, taste and microbial safety against BIS IS 10500 or the WHO guidelines.
Industrial Process Water Plants
Influent is the incoming supply, and effluent is the water that meets the process specification. Boiler feed, cooling, pharma and food plants each need a different effluent quality, so the target, not the source, drives the design.
Sewage and Effluent Treatment Plants (STP and ETP)
Influent is the raw sewage or industrial wastewater, and effluent is the treated water released or reused. Here, the comparison leans on BOD, COD, TSS and pH, and the effluent must meet the discharge limit set by the state pollution control board or the reuse standard.
The stages of water treatment follow the order in which impurities are easiest to remove: coarse material first, fine suspended and dissolved matter next and disinfection and polishing last. Comparing raw water and treated water samples at each stage shows what each step has achieved. Since 2015, 961 million more people have gained access to safely managed drinking water, lifting global coverage from 68% to 74%, according to the WHO and UNICEF Joint Monitoring Programme.
How to Monitor Influent and Effluent Quality
Good monitoring depends on sampling at the right points and often enough to catch change.
- Sample at the plant inlet, at the outlet of each major stage and at the final outlet
- Test across seasons, since monsoon, summer and borewell depletion can change influent quality
- Use online sensors for turbidity, pH, conductivity and residual chlorine where continuous control matters
- Confirm critical parameters, such as microbial quality, with laboratory tests
- Keep records so trends are visible before the effluent drifts out of limits
Common Reasons Effluent Misses the Target
- Influent changes that the design did not allow for, such as higher turbidity, TDS or organic load than planned
- Exhausted media, such as spent filter media, carbon or ion exchange resin
- Membrane fouling or scaling that lowers rejection
- Wrong chemical dosing, or sensors that need calibration
- Too little contact time or too low a dose in disinfection
Most of these show up first as a shrinking gap between influent and effluent at one stage, which is why stage-wise sampling helps.
Choosing a Treatment Process Based on Influent and Effluent Targets
- Analyse the influent across seasons: turbidity, TDS, hardness, iron, microbes and, for wastewater, BOD and COD
- Define the effluent target: the drinking water standard, the process specification or the discharge limit
- List the gap for each parameter
- Match each gap to a step, for example turbidity to clarification and filtration, hardness to softening, dissolved salts to RO and microbes to disinfection
- Add margin, standby equipment and room to expand
Actual removal efficiency depends on contaminant characteristics, feedwater quality and system design, so a pilot or a detailed water analysis is worth doing before the final selection.
Major Water Treatment Processes: Mechanism, Scope, and Efficiency
Each water treatment process targets different contaminants, so most plants combine several. Physical steps remove solids, chemical steps handle fine and dissolved matter, ion exchange and adsorption remove hardness and specific dissolved impurities, and membranes and disinfection refine the water for drinking or process use.
Physical vs. Chemical Water Treatment
Physical Separation Methods (Screening, Sedimentation, and Media Filtration)
Screening removes large items, sedimentation settles solids, and sand or multimedia filters capture finer particles. These methods rely on gravity and flow, making them the core of conventional water treatment.
Chemical Clarification Methods (Coagulation, Flocculation, and Precipitation)
Coagulants such as alum or ferric salts neutralise the charge on tiny particles. Flocculation gathers them into larger clumps, and precipitation turns dissolved metals into solids that can be separated. These water treatment techniques target particles that settle too slowly on their own.
Key Operational & Cost Differences
Physical separation can reduce chemical consumption, while chemical treatment requires dosing, monitoring and additional sludge handling. Actual operating costs depend on the water quality and plant design.
Biological Treatment: Aerobic vs. Anaerobic Processes
Aerobic and anaerobic treatment work in different ways. Aerobic systems use supplied oxygen to break down organic matter and can produce treated effluent suitable for further polishing. Anaerobic systems treat high-strength wastewater without aeration and can generate biogas, although additional treatment may be needed before discharge or reuse.
Activated Sludge vs. Membrane Bioreactor (MBR) Systems
Activated sludge relies on a settling tank to separate biomass. A membrane bioreactor (MBR) uses membranes instead of conventional secondary settling tanks to separate biomass, generally providing a smaller footprint and better suspended-solids removal, but with higher energy requirements.
Moving Bed Biofilm Reactor (MBBR) vs. Fixed-Film Systems
MBBR uses small plastic carriers that move freely in the tank and provide surfaces for microbial growth, and the amount of media can be adjusted within the reactor's design limits to increase the available surface area for treatment. Fixed-film systems such as trickling filters keep the media in place, which suits steady flows and simple operation.
Biological Oxygen Demand (BOD) & Chemical Oxygen Demand (COD) Removal Comparison
Both activated sludge and MBR systems can achieve high BOD removal. MBR systems also provide more effective suspended-solids separation, although actual performance depends on design and operating conditions. COD measures the total amount of chemically oxidisable substances in water, including both biodegradable and non-biodegradable matter. Additional treatment may be needed to remove compounds that biological processes cannot break down effectively.
Membrane Technologies: MF vs. UF vs. NF vs. RO
Membranes are central to modern water purification processes, and pore size sets what each one removes.
Microfiltration (MF) and Ultrafiltration (UF) for Suspended Solids & Pathogens
Microfiltration and ultrafiltration differ mainly in pore size. Microfiltration holds back suspended solids and most bacteria. Ultrafiltration removes suspended solids, colloids and bacteria, and can reduce some viruses depending on membrane characteristics and system performance.
Nanofiltration (NF) for Hardness and Organic Removal
Nanofiltration softens water by reducing calcium and magnesium, and it removes many organic compounds and some dissolved salts.
Reverse Osmosis (RO) for Total Dissolved Solids (TDS) and Desalination
Reverse osmosis removes most dissolved salts, which makes it the standard choice for seawater desalination and for industrial feed water with high TDS.
Pressure, Flux Rate, and Recovery Rate Differences
Typical operating pressures are 3.5 to 16 bar for NF, 10 to 25 bar for brackish water RO and 55 to 70 bar for seawater RO. MF and UF generally operate at lower pressures than NF and RO. Flux is generally higher in MF and UF. Recovery in brackish water RO commonly ranges from 75 to 85%, while seawater RO typically achieves 40 to 50% recovery. Actual operating pressures and recovery rates vary depending on feedwater quality, temperature, membrane specifications and system design.
Disinfection & Advanced Oxidation Processes (AOP)
Chlorination vs. Ultraviolet (UV) Irradiation
Chlorination leaves a residual that protects water in distribution pipes, which is why it features in many drinking water treatment methods. UV uses light instead of chemicals and works well on clear water, though it leaves no residual in the pipes.
Ozone Generation vs. Advanced Oxidation Processes (AOP)
Ozone oxidises organics, colour and odour compounds. AOP combines ozone, UV or hydrogen peroxide to form hydroxyl radicals that break down stubborn organics. It costs more, so it is chosen for specific compounds.
Conclusion
Comparing influent and effluent helps assess what a water treatment plant achieves: influent shows the problem, and effluent shows the result. Understanding the difference helps you design the right process, spot a failing stage early and prove compliance with the standard that applies.
If you are planning a new plant or an upgrade, we can review your influent data and suggest a suitable process and treatment plant. As a water treatment manufacturer, Alantech offers water treatment plants such as reverse osmosis, ultrafiltration, seawater desalination, softening and DM plants, packaged drinking water plants, sewage treatment, effluent treatment, membrane bioreactor and zero liquid discharge systems. Contact Alantech to share your requirements with us.
Frequently Asked Questions (FAQs)
Q1: What is the difference between influent and effluent?
Influent is the untreated water that enters a treatment plant, and effluent is the treated water that leaves it. Comparing the two shows how well the plant removes solids, salts, hardness, organics and microbes.
Q2: Is effluent the same as wastewater?
Not exactly. Wastewater is used water before treatment, and in a treatment plant it is the influent. Effluent is the water that comes out after treatment, although the word is also used for waste streams such as backwash and RO reject.
Q3: Which parameters are compared between influent and effluent?
Common ones are turbidity, suspended solids, TDS, hardness, pH, iron, manganese and microbial quality. For wastewater, BOD and COD are added.
Q4: Why is influent tested before a plant is designed?
Influent quality sets the capacity, the sequence of treatment steps and the chemical doses. Without seasonal influent data, a plant can be undersized or fail to reach the effluent target.